How to add usage tracking to a .NET application in 30 minutes
If you think adding usage tracking to your application will be hard, this post is for you. I'll detail how to take an application, in this case a .NET app, and quickly integrate analytics into it so you can begin capturing how your customers use it. By the end you'll have a real .NET application that captures user actions, groups them into sessions, and is able to track events when the network is down. The data shows up in your online dashboard. No piping events through a web framework. No browser. No JavaScript. Just a NuGet package (in this case) and the application you already have.
The example is a WinForms inventory manager. WinForms is the one .NET UI framework that you may think is unfashionable, but there are thousands of production WinForms apps still shipping. The Beacon .NET SDK works there, and it works in your WPF app, your MAUI app, your console tool, your ASP.NET Core service, and your Avalonia cross-platform client. The integration procedure is identical.
Disclosure: I build the SDK we're going to use. It's called Beacon. There are other product analytics tools but most of them assume your app is a webpage. This one doesn't. C++ and JavaScript SDKs are also provided.
What you'll have at the end
A real running app, events arriving in a dashboard, and exception tracking wired up. Here's what you need before the clock starts:
- Almost any .NET runtime. The latest SDK multi-targets .NET 8/9/10, .NET 6/7, .NET Framework 4.8, and .NET Standard 2.0 - so it runs whether you're on a decade-old WinForms app still on the .NET Framework or a brand-new .NET 10 service.
- A Beacon account. See the free trial link below.
- About 30 minutes.
No database to set up. No infrastructure. No Docker. The Beacon service is hosted and the SDK talks to it over HTTPS. What helps make this a short task? The SDK ships as a NuGet package. You configure it once at startup, it persists events to disk automatically when you're offline, and it silently keeps sending the data to the cloud where you can view all kinds of reports in the Beacon portal.
Follow along with the real project on GitHub. Clone SoftAgility/beacon-sdk-dotnet and open examples/winforms-starter/ - that's this exact inventory app with no Beacon yet, annotated with // TUTORIAL - Step N markers at every spot where the steps below plug in. dotnet run and you've got the "before." The finished, fully-instrumented version sits right next to it in examples/winforms/ if you'd rather read the "after."
Step 0 - Sign up and grab an API key (3 minutes)
Sign up at beacon.softagility.com/signup. No credit card. 21-day trial.
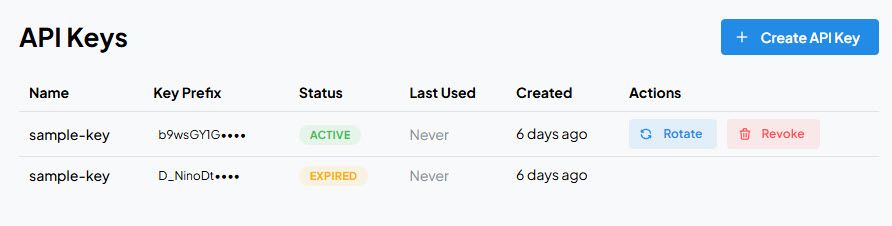
Once you're in, create a Product and note its slug - you'll pass that exact string as options.Product in Step 2. Then open the API Keys page and create a key. Copy it right away: the full key is shown only once, in the dialog that appears when you create it (there's a copy button and a "download as .txt" option). The base URL is the same for everyone - https://api.beacon.softagility.com - and it comes pre-filled in the SDK snippet the dashboard shows you on first run, so you rarely have to type it by hand.
One thing to get right now so you don't lose ten minutes later: the Product value in your code must match a product slug you've registered in the portal. Beacon does not auto-create products. An event whose product doesn't match a registered slug is rejected and never reaches your dashboard. Registering the product here is what makes your events show up in Step 6.
Step 1 - Install the NuGet package (2 minutes)
dotnet add package SoftAgility.Beacon
This will pull down the SDK package. If you live in Visual Studio, you can use the UI or the Package Manager Console:
Install-Package SoftAgility.Beacon
Package:
SoftAgility.Beaconon NuGet -dotnet add package SoftAgility.Beacon
Step 2 - Configure the SDK on startup (5 minutes)
There are two configuration patterns. Pick the one that matches your app's shape.
Pattern A - static singleton (WinForms, WPF, console, anywhere without DI)
using SoftAgility.Beacon;

BeaconTracker.Configure(options =>
{
    options.ApiKey = "<paste-your-api-key>";
    options.ApiBaseUrl = "https://api.beacon.softagility.com";
    options.Product = "InventoryManager";   // must match the registered product slug
    options.ProductVersion = "1.0.0";

    // Optional: Declare every event your app will track, up front.
    options.Events
        .Define("inventory", "item_added")
        .Define("inventory", "item_edited")
        .Define("inventory", "item_deleted")
        .Define("inventory", "search_performed")
        .Define("reporting", "csv_exported");
});
Configure creates a singleton you can reach anywhere via BeaconTracker.Instance. It's safe to ship without a key: if ApiKey, ApiBaseUrl, or Product is missing or empty, the SDK logs a warning and becomes a no-op - every call is silently ignored and your app runs normally. The only thing Configure throws on is being called a second time.
The options.Events.Define(...) block is optional, but it allows you to predefine all the valid events you will track. It declares each (category, name) pair your app emits. Its purpose is to produce a JSON manifest (via BeaconTracker.Instance.ExportEventManifest(path)) that you upload to the portal's Allowlists Import page. Think of it as an 'event schema' you keep in one place. The SDK does not enforce this list client-side: Track("anything", "anywhere") always sends, declared or not. Enforcement is a backend opt-in. With no allowlist active (the default), every event is accepted. But once you activate an allowlist for the product, the backend rejects any event whose (category, name) isn't on it, and those undeclared events stop reaching your dashboard. The portal can then flag undeclared events for you, helping you debug your instrumentation. This optionally declared 'event schema' also gives the portal an explicit list of events to expect, which is what powers part of the Usage Insights and Missing Events reports: they flag the declared events that aren't arriving, so you can spot both a feature that's fading and one nobody uses at all.
Pattern B - DI registration (ASP.NET Core, Worker Service, generic host)
The static singleton above is all a WinForms, WPF, or console app needs, and it's the path the rest of this tutorial follows. But if you're wiring Beacon into something that already uses Microsoft.Extensions.DependencyInjection, register it in the container instead. Here's the same setup in an ASP.NET Core service - say, the inventory manager's companion sync API:
var builder = WebApplication.CreateBuilder(args);

builder.Services.AddBeacon(options =>
{
    options.ApiKey = builder.Configuration["Beacon:ApiKey"]!;
    options.ApiBaseUrl = builder.Configuration["Beacon:ApiBaseUrl"]!;
    options.Product = "InventorySyncApi";   // its own registered product slug
    options.ProductVersion = "2.1.0";
});
AddBeacon registers BeaconTracker as a singleton and exposes it as IBeaconTracker. Inject that interface into your controllers, handlers, and services. (A Worker Service or any generic-host app is identical - swap WebApplication.CreateBuilder for Host.CreateApplicationBuilder.) One rule: don't call .Dispose() yourself when using DI - the container owns the lifetime. The options here are the same BeaconOptions as Pattern A, so anything you'd set there, including options.Events.Define(...), works identically - the only difference is that you export the manifest from the injected IBeaconTracker rather than from BeaconTracker.Instance.
Each app or service you instrument is its own Beacon Product with its own slug, so the desktop client (InventoryManager) and its sync API (InventorySyncApi) show up as two products you can analyze separately or together.
For the rest of this tutorial I'll assume a field named _tracker that holds the tracker - BeaconTracker.Instance in Pattern A, or the injected IBeaconTracker in Pattern B. The call sites are the same either way.
Step 3 - Identify a user and start a session (3 minutes)
// Wherever you have the current user ID after startup:
_tracker.Identify("a-stable-user-or-install-id");

// Then on app / window / page load:
_tracker.StartSession();
Identify sets the actor - Beacon's word for "whoever is using your app." It's whatever stable ID your app already has: a user GUID, an account ID, a license key, an install ID. Keep it pseudonymous: pass an opaque identifier, not personal data like a raw email, since whatever you send is stored as the actor ID. (If an email is the only stable handle you have, hash it first and pass the hash.) Beacon doesn't care what the value is, only that it's consistent for the same person. You can call Identify again when a user logs out and another logs in.
StartSession opens a session: a group of events from one sitting. Beacon assigns and tracks the session ID for you - you don't manage it. Every Track() call after this automatically rides along with the active session.
"What if my app doesn't authenticate at all?" Use a stable machine-generated ID - for example, an installation GUID you store in user preferences the first time the app runs. That gives you per-install analytics without a login screen. (If you track nothing at all before identifying, Beacon assigns an anonymous device ID and links it to the real actor the moment you call Identify - so you don't lose the pre-login activity.)
Step 4 - Track three meaningful events (8 minutes)
This is the biggest step because it's the one that matters. Three real events:
// 1 - A feature was used.
_tracker.Track("inventory", "item_added", new
{
    item_category = item.Category,
    quantity = item.Quantity
});

// 2 - A user completed an export.
_tracker.Track("reporting", "csv_exported", new
{
    row_count = _items.Count
});

// 3 - A signal that something's frustrating: searches that come up empty.
_tracker.Track("inventory", "search_performed", new
{
    query_length = txtSearch.Text.Trim().Length,   // the length, never the text (could be PII)
    results_count = GetFilteredItems().Count
});
Why two fields, category and name? Category is the surface area (inventory, reporting), name is the action (item_added, csv_exported). The split lets you ask "show me everything in inventory" without a LIKE '%inventory%' query.
The property constraints are: max 20 properties per event, keys up to 64 characters, values up to 256 characters, no nested objects, no arrays. Flat dictionaries of scalars only. This is deliberate - it's what keeps queries fast and aggregations cheap at scale.
That being said, the nesting could trip you up so I'll give an example here:
// WRONG - the nested 'changes' object is silently dropped (with a warning
// log via BeaconOptions.Logger). The event still tracks, just with zero
// properties:
_tracker.Track("user", "profile_updated", new
{
    changes = new { name = "...", email = "..." }
});

// RIGHT - flatten so each property is a scalar:
_tracker.Track("user", "profile_updated", new
{
    changed_name = true,
    changed_email = true
});
Note the "drop, don't reject" behavior: the SDK never refuses an event payload. It sanitizes invalid properties out and tracks the event anyway. That's intentional - it means a malformed property never costs you an event, which matters for offline robustness. Wire BeaconOptions.Logger to an ILogger if you want visibility into what got dropped.
Finally: Track() is non-blocking. It drops the event onto an in-memory queue and returns immediately - no network call on your thread. The SDK flushes asynchronously every so often (configurable via FlushIntervalSeconds) or when the queue hits the batch size, whichever comes first.
Step 5 - Add exception tracking (5 minutes)
Beacon ships a first-class TrackException(ex, severity) method that does three things you'd otherwise write yourself:
- Preserves the full stack trace - sent to a dedicated exception-ingest endpoint, not flattened into an event property.
- Attaches breadcrumbs automatically - the last N
Track()calls (default 25, configurable viaBeaconOptions.MaxBreadcrumbs) are bundled with the report. You see what the user did right before the crash without writing a single line of breadcrumb code. - Returns immediately and never throws - fire-and-forget HTTP POST, safe to call from any code path including shutdown hooks.
Wire two unhandled-exception hooks at startup:
// In Program.cs, before Application.Run():
AppDomain.CurrentDomain.UnhandledException += (sender, args) =>
{
    if (args.ExceptionObject is Exception ex)
    {
        BeaconTracker.Instance?.TrackException(ex, ExceptionSeverity.Fatal);
    }
};

// WinForms-specific - UI thread exceptions (non-fatal; the app keeps running):
Application.ThreadException += (sender, args) =>
{
    BeaconTracker.Instance?.TrackException(args.Exception, ExceptionSeverity.NonFatal);
};
That's six lines plus the using statement. The SDK handles serialization, breadcrumb attachment, and offline persistence.
You can also call TrackException from inside any try/catch for handled failures you want to track:
try
{
    File.WriteAllText(exportPath, csv);
}
catch (IOException ex)
{
    BeaconTracker.Instance?.TrackException(ex, ExceptionSeverity.NonFatal);
    // ... then show a user-friendly error
}
The TrackException method itself works on every plan tier, and the report lands in the backend regardless. The portal's Exceptions UI - stack-trace fingerprinting, automatic grouping by signature, occurrence timelines, tenant-wide aggregation - unlocks on Pro and above. So a trial-tier reader can capture exceptions today and turn on the aggregation views later (the gating is about reading the data, not about whether the call is accepted).
Step 6 - Dispose cleanly and see your data (4 minutes)
// WinForms FormClosing handler (or any app shutdown hook):
private void MainForm_FormClosing(object? sender, FormClosingEventArgs e)
{
    BeaconTracker.Instance?.Dispose();
}
Dispose flushes the in-memory queue to disk, releases the SQLite connection, and prevents data loss on shutdown. (Again: in a DI app, skip this - the container disposes the singleton for you.)
Now run the app. Click a few things - add an item, export a CSV, search for something. Close it.
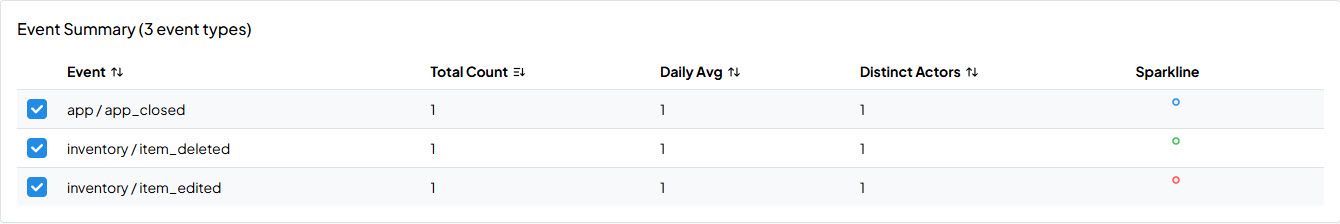
Open the Beacon portal and go to Events. One thing to set expectations: Beacon processes ingested events on a cycle, not in real time, so don't expect them the instant you close the app. Give it a few minutes for the next processing cycle to run. Once it does, your events are there: sorted by timestamp, filterable by category, with property values visible. That's the full loop, from a click in your .NET app to a row in a real dashboard.
What happens when the network is down
You've seen the happy path. The obvious follow-up: what if the user is offline?
Nothing changes in your code. Beacon writes every event to a local SQLite queue the moment a send fails, so network failure is invisible to your Track() calls. The flush worker retries with exponential backoff, and when connectivity returns the queued events sync automatically. The on-disk queue is size-capped (10 MB by default, configurable by you) so a long offline stretch can't fill the user's disk.
Want to prove it? Turn off WIFI mid-tutorial, click a few more things, turn WIFI back on, and watch the dashboard. After the next backend processing cycle you'll see the events show up. This is the single biggest difference between Beacon and a web analytics tool. JavaScript analytics drops events on offline tabs. Beacon's native SDK persists them, and for desktop software, where "offline" is all day Tuesday, that's the whole ballgame.
What to track next
You instrumented three events. You'll want 15-25 before you have enough to make decisions. A solid starter set for almost any desktop app:
- App launched
- App closed (with session duration)
- First-time user vs. returning user
- Main view / dashboard opened
- Your top 3-5 features used
- Settings opened
- Help opened
- Update prompt shown / accepted / dismissed
- License key entered / accepted / rejected
- Export / share / save-as actions
A few SDK capabilities you didn't need for the 30-minute path, but are worth knowing exist when you go further:
SetAccount/SetLicense- attach account and license specific context to events, so a B2B vendor can ask "which customer accounts went quiet this month?" instead of only "which users?" (Both take opaque IDs your app picks - Beacon never sees names or emails.)OptOut/OptIn- a one-call privacy switch.OptOutpersists to disk and makes tracking a no-op untilOptIn(useful for GDPR-style consent toggles).Reset- clears identity and session and rotates the anonymous device ID, e.g. on logout on a shared machine.
Conclusion
You did the integration in about 30 minutes, and you have a working pipeline from your .NET app to a real dashboard. The next phase is the harder one: deciding which questions to ask. Tracking is the easy part once the SDK is in - asking the right questions is the rest of the job.
Ready to instrument your app? Free 21-day trial, no card. Start the trial → or browse the SDK docs first.